
Analytics
Numbers computed from real money.
Every number comes from your real subscriptions and real charges. If it's on the screen, actual money is behind it.
85%
Subscribers retained · all time
Home opens on today
Revenue by day split into renewals, checkout and add-ons, a 7-day average line, and the four numbers that matter — before you click anything.
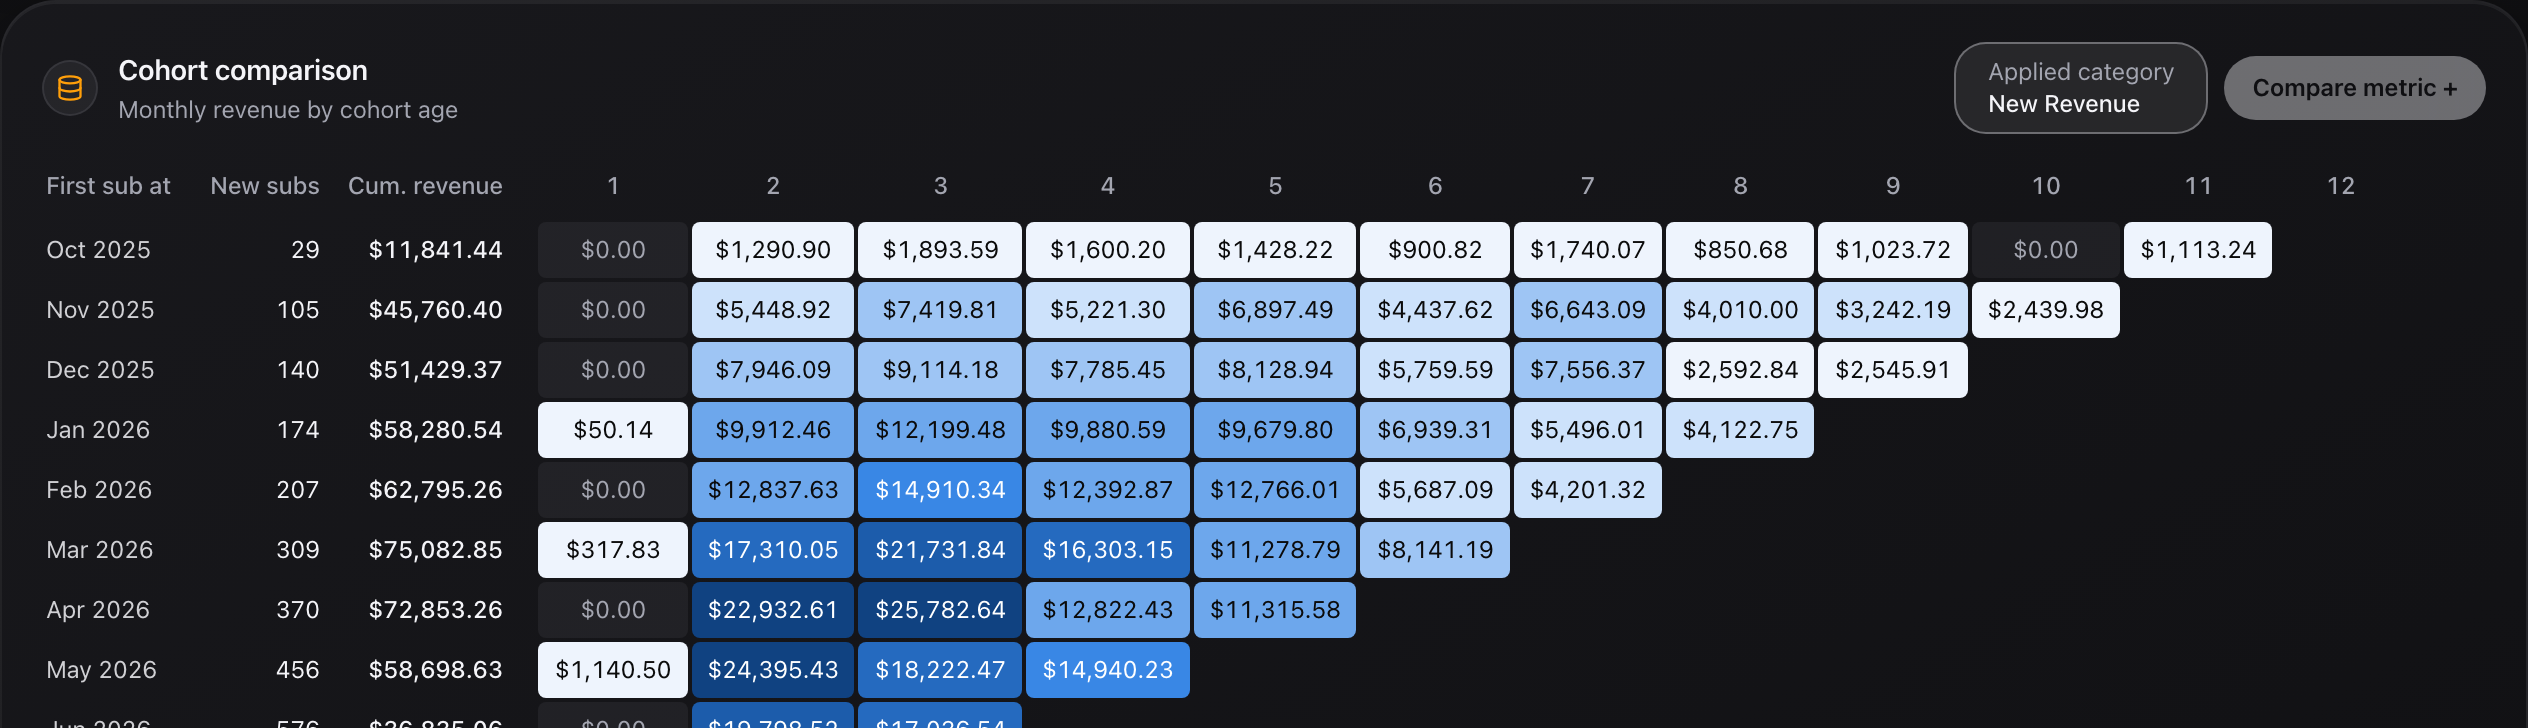
How long customers stay
Each month's cohort tracked by orders and spend — your real customer value.
Churn by cycle
See which billing cycle loses customers — and aim your offers exactly there.
Recovered revenue
What failed, what the retries won back, and what that saved you this month.
A forecast you can trust
Built from your actual upcoming renewal dates — not a trend line.
Cancellation intelligence
Every reason, offer, and save — retention decisions on evidence.
Product performance
Which products convert, which frequencies stick, where AOV is heading.
Export anything
Every report exports to CSV for the date range you picked — payment recovery and product performance included.
Date presets that apply on tap
Today, week to date, month to date, last 30 — one tap, weeks start Sunday, nothing to confirm.